Material Balance and Environmental Accounting
Material Balance
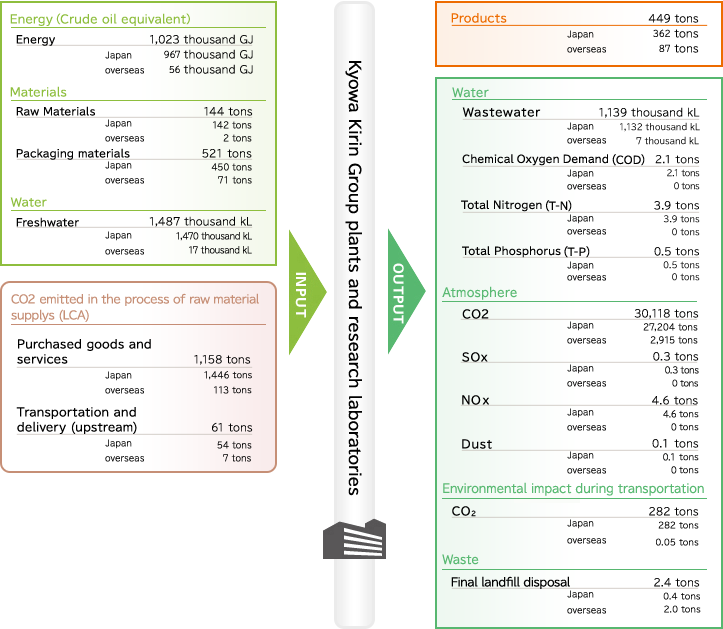
The Kyowa Kirin Group strives to reduce its environmental impact. The following shows an overview of the Group’s environmental impact in fiscal 2023 imposed by its plants and research laboratories.

- *Due to rounding, some totals may not correspond with the sum of the breakdown.
Environmental Accounting
The Kyowa Kirin Group identifies how much investment was made in environmental protection and the economic effects in quantitative terms. In 2023, total investment and total costs amounted to ¥638 million and ¥1,154 million, respectively. In response to the reorganization of production and research laboratories and the need to improve productivity, new buildings are being constructed with energy-efficient equipment and other environmentally friendly features. The economic effect generated by recycling waste (as valuable resources) and saving energy amounted to approximately ¥18 million.
You can see this table by scrolling horizontally.
| Cost classification | FY2021 | FY2022 | FY2023 | ||||
|---|---|---|---|---|---|---|---|
| Investment | Expense | Investment | Expense | Investment | Expense | ||
| (1) Business area cost | 1,269 | 725 | 1,043 | 561 | 638 | 1,039 | |
| Details | (1)-1 Pollution prevention cost | 847 | 411 | 712 | 236 | 263 | 616 |
| (1)-2 Global environment conservation cost | 396 | 113 | 329 | 51 | 149 | 182 | |
| (1)-3 Resource circulation cost | 26 | 201 | 2 | 274 | 226 | 241 | |
| (2) Upstream/downstream cost | 0 | 0 | 0 | 1 | 0 | 1 | |
| (3) Administration cost | 9 | 194 | 19 | 144 | 0 | 110 | |
| (4) R&D cost | 0 | 0 | 0 | 0 | 0 | 0 | |
| (5) Social activity cost | 0 | 1 | 0 | 2 | 0 | 4 | |
| (6) Environmental remediation cost | 0 | 0 | 0 | 0 | 0 | 0 | |
| Total | 1,278 | 921 | 1,063 | 709 | 638 | 1,154 | |
(Millions of yen)
You can see this table by scrolling horizontally.
| Item | Activities | FY2021 | FY2022 | FY2023 |
|---|---|---|---|---|
| Total investment | Expansion and rationalization of production and research facilities | 8,435 | 18,003 | 13,705 |
| Total R&D cost | R&D for new products and technologies | 55,543 | 55,596 | 62,137 |
| Sales of valuables in connection with (1)-3 and (2) | Used paper and scrap metal, and waste plastic | 6 | 3 | 5 |
| Resource-saving effects in connection with (1)-2 and (1)-3 | Energy and resource conservation and waste reduction | 16 | 38 | 12 |
(Millions of yen)
- *1:Calculated based on "Environmental Accounting Guidelines 2005 (Ministry of the Environment)".
- *2:Due to rounding, some totals may not correspond with the sum of the breakdown.